Market Lab
Review asset pulse metrics, chart periods, top movers, shortcut panels, and watchlist context from a focused dashboard.
Valoria brings organized watchlists, K-line style charts, delayed quote comparisons, source-aware news, ETF flow dashboards, risk sizing tools, and a virtual paper-trading journal into one English workspace for digital asset learners.
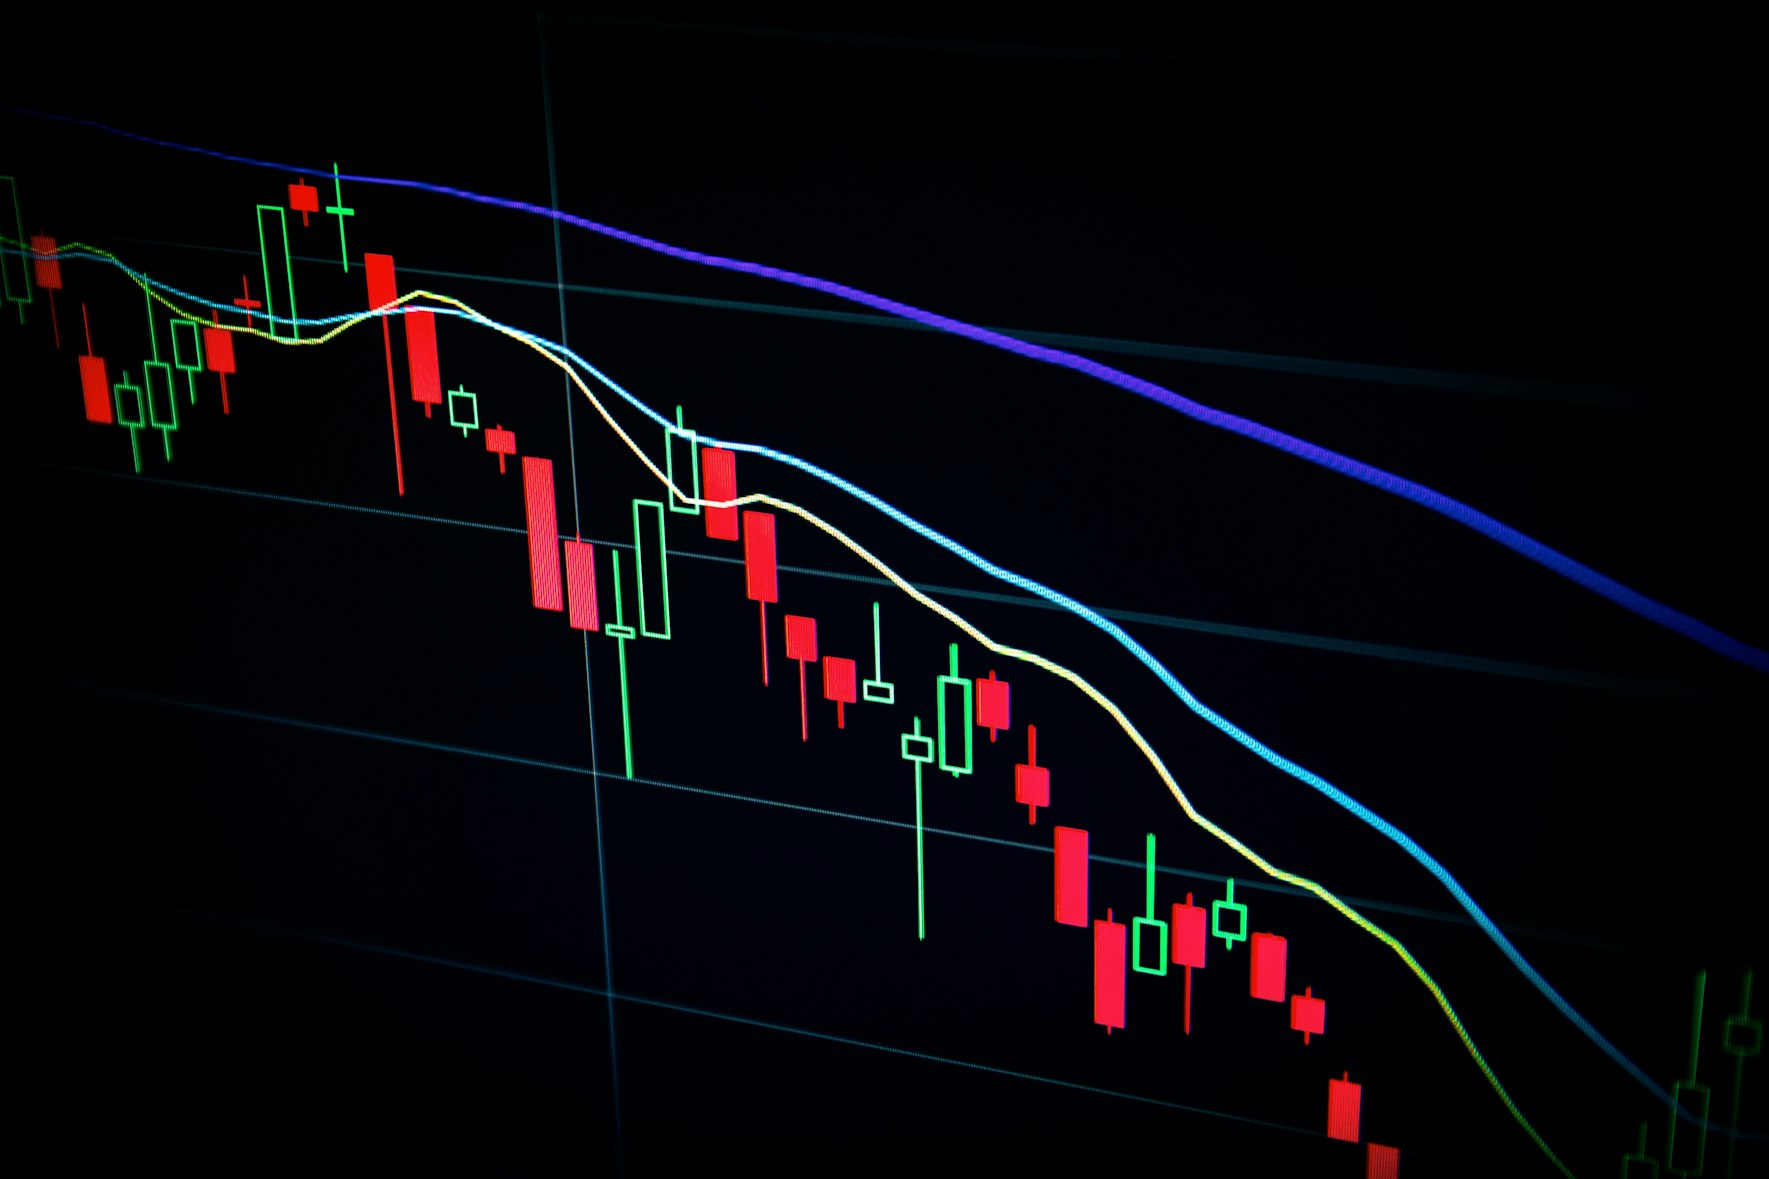
Move from scattered charts and headlines to a structured loop for monitoring, research, risk planning, simulation, and review.
24-hour context and movers
K-line periods and profiles
Sources, ETF flows, quotes
Journal and performance stats
Review asset pulse metrics, chart periods, top movers, shortcut panels, and watchlist context from a focused dashboard.
Inspect price context, profile notes, order book depth examples, source notes, and watchlist actions for each asset.
Use a screener, source-aware news, ETF flow chart, risk calculator, and delayed quote comparison for structured study.
Open and close virtual positions, keep a trade journal, and review win rate, net P/L, profit factor, and max drawdown.
Valoria keeps the digital asset research cycle organized so learners can review their reasoning and improve their process.
Build watchlists, inspect top movers, and compare delayed 24-hour asset metrics.
Read source-aware news, review ETF flows, inspect profiles, and compare quote sources.
Size risk, open virtual positions, close trades, and review the paper-trading journal.
Core spaces: Market Lab, Asset Detail, Research Lab, Paper Desk, Learn.
Metric comparisons for digital asset market study.
Investment outcome promises or advice claims.
Virtual practice journal for simulation-based learning.
Download Valoria for structured research, risk sizing, and paper-trading practice.